With so many different perspectives, how much renewable generation is there in reality?
The amount of renewable generation is growing and forms a core part of the generation mix, not bad from a near standing start in the early 2000’s.
But with so many different views being reported – how much renewable generation is there really in the GB market?
The answer – like so much is it depends how you present it. Want a high number – choose a day when its sunny and windy; want a small number choose a day when its cloudy and still. Nether really do much to help explain what is really going on in a meaningful way.
The only fixed element at any point in time is the capacity, but the volume varies significantly, and depending on the point you want to make can be skewed accordingly. Lies, damn lies and statistics…
What it means for any consumer being told they have 100% renewable supply – again that depends on how you want to view it, although 24/7 supply is a long way off.
So to look at things from a number of perspectives, the below analysis looks at different time frames to provide some clarity. All data sourced from either National Grid ESO or DUKES.
The conclusion – short term output from renewable generation is highly volatile. This is hardly a surprise, but does demonstrate the need to be clear on the full costs associated with high level of intermittency (network, balancing and reserve) as well as the reality of tariff labelling for consumers to ensure long-term buy-in to decarbonisation.
In energy, perspective matters and taking a wide view is the best way to long term success.
Generation Capacity
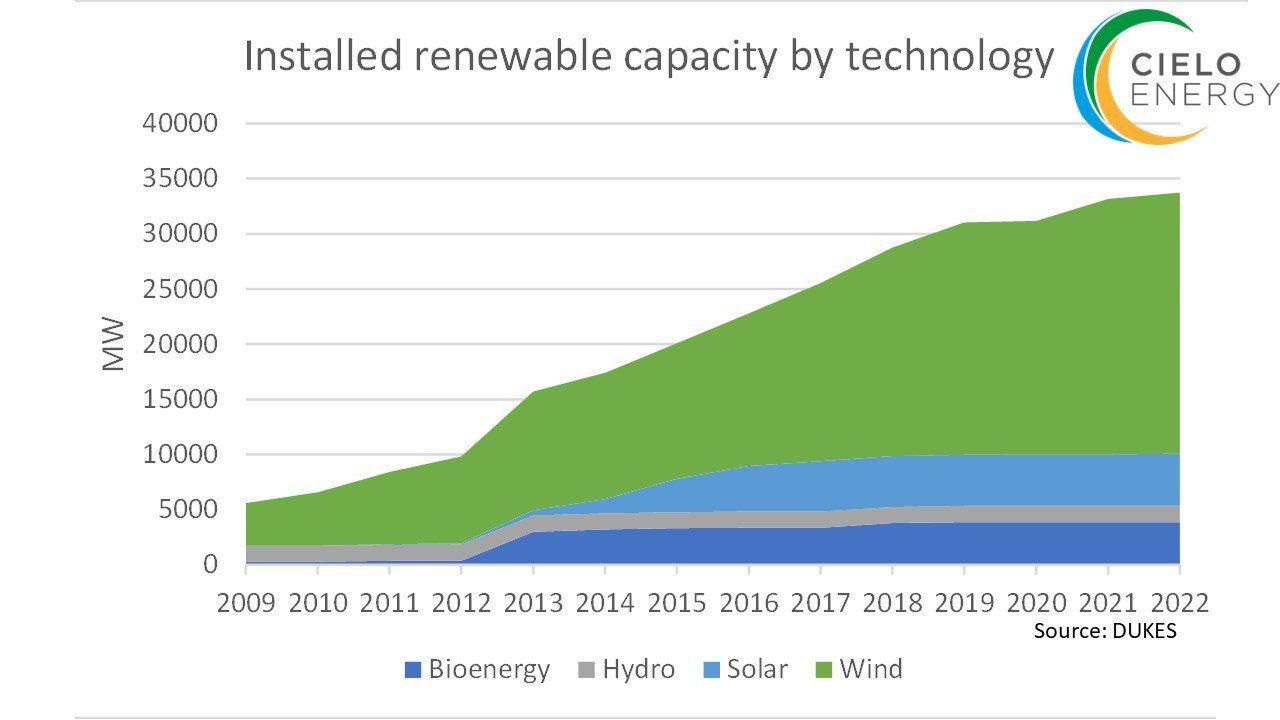
The ability to generate electricity is limited by the amount of capacity available at any time.
Although growth in renewable capacity has been predominantly in wind, the rate of growth has clearly slowed in the past couple of years. The target is to add 10’s of GW over the coming years, so the install rate needs to accelerate significantly to achieve this.e body content of your post goes here. To edit this text, click on it and delete this default text and start typing your own or paste your own from a different source.
Short Term Generation
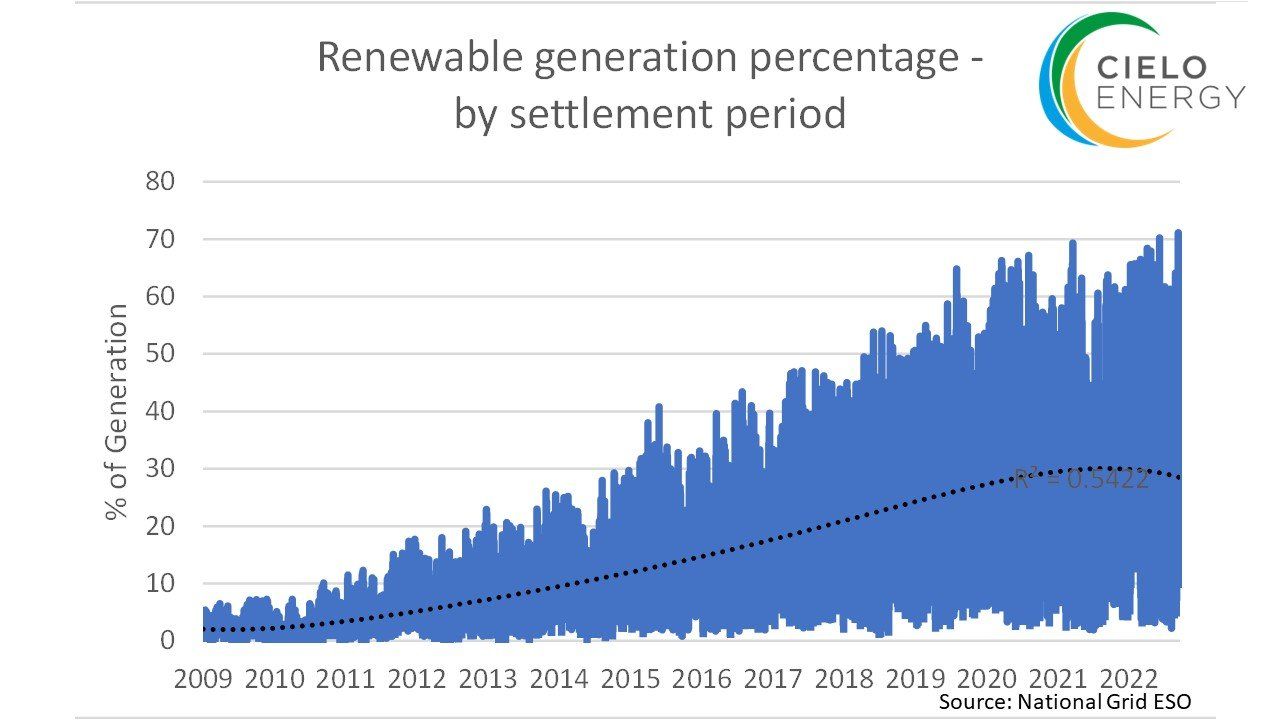
On a full half hour by half hour basis the picture is incredible volatile. There are some periods of near 70% renewable, others of 3% (which is broadly unchanged over recent years). The line of best fit is around 30% over recent periods – although it had trended downwards recently – presumably due to low winds experienced for a reasonably long period in 2021.
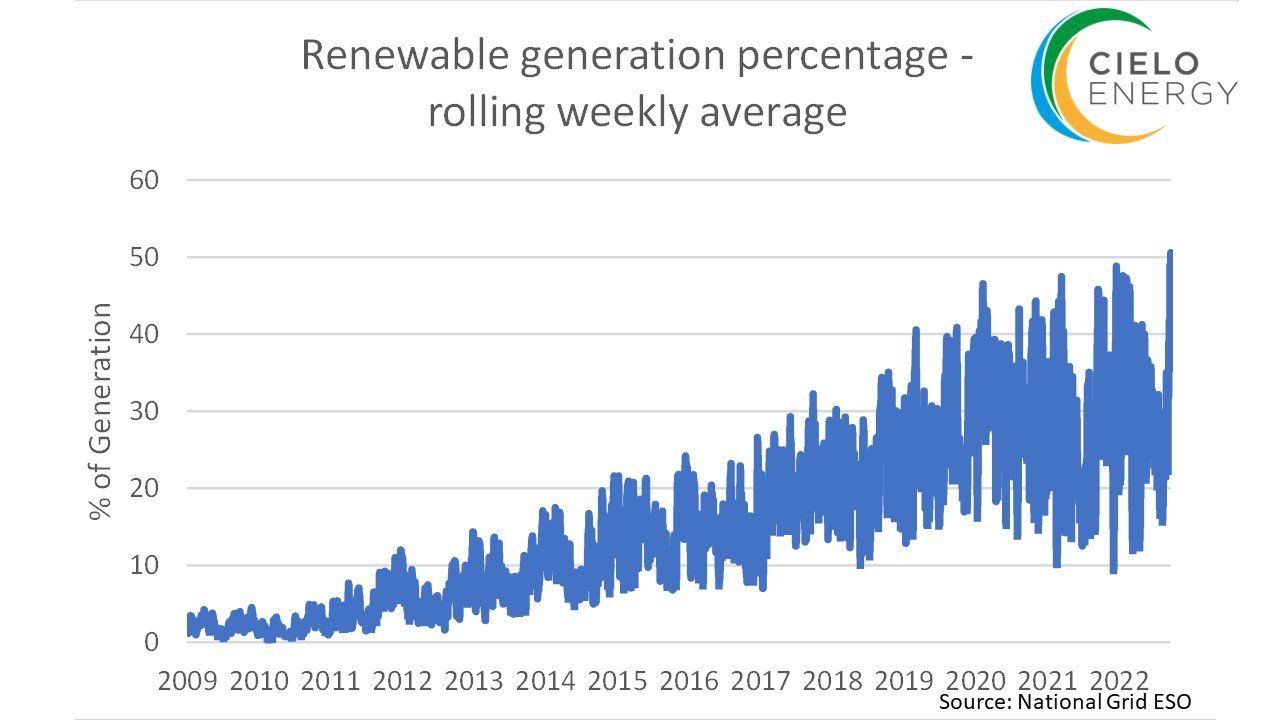
Short term generation – weekly
A rolling week (168 hour) period removes some of the noise of real time tracking. The long-term upward trend until 2020 remains intact. Recent ranges between 15 – 50%
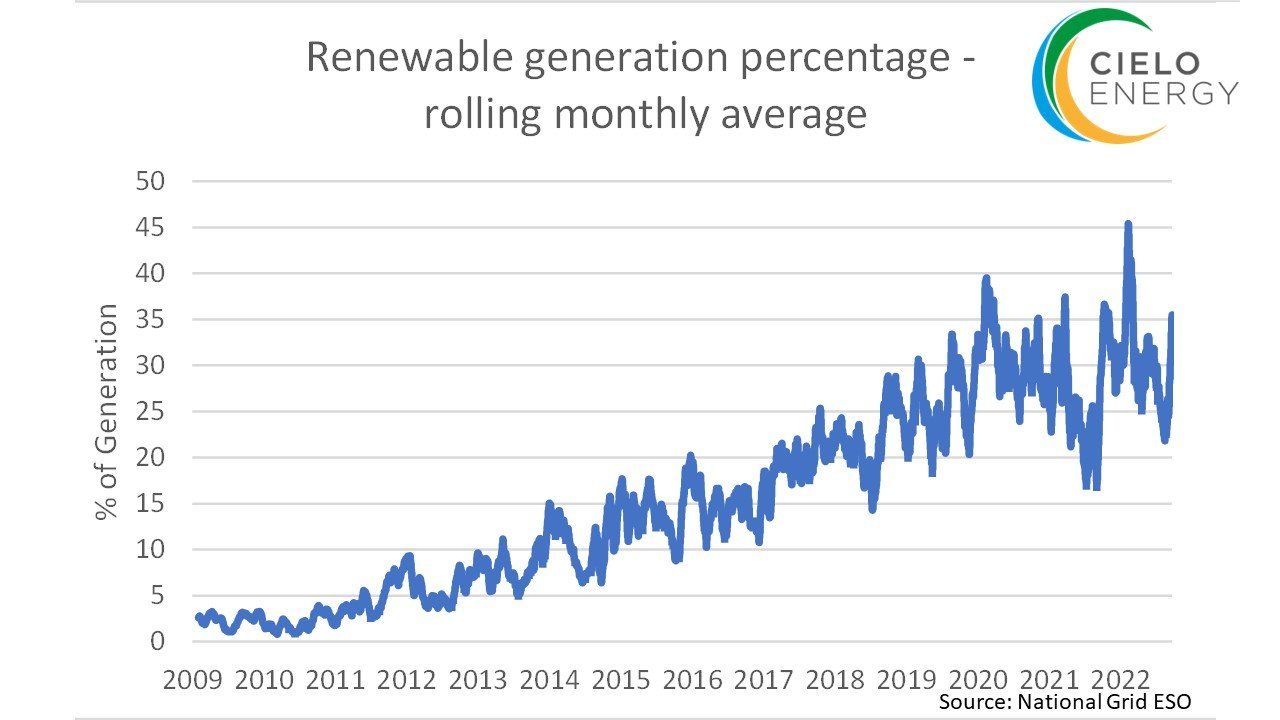
Mid term generation – Monthly
Using longer averaging periods (in this case 31 days) removes the short-term noise further, with averages ranging from 20% -40% over recent periods.
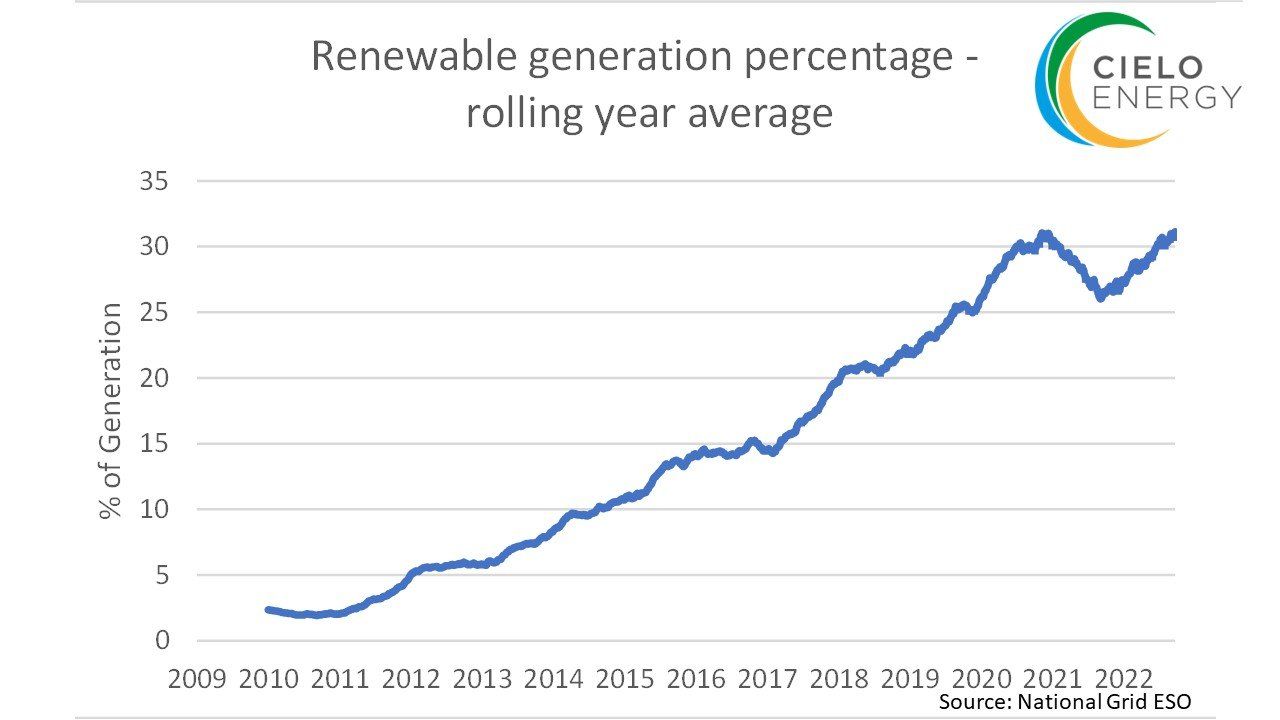
Long Term generation – yearly
A rolling annual (8760 hours) profile creates a much more stable profile trend as would be expected by the longer horizon. As with shorter time horizons the consequences of the low wind period in 2021 has a major impact on the rolling average, which has only recently been surpassed.
Share this on social media
All Rights Reserved | Cielo Energy
REG NO: 11992760 | ICO REG NO: ZA757421


